
Learning how to read a topographic map can seem confusing at first. Brown lines twist across the page, numbers appear at seemingly random intervals, and familiar features like hills and valleys are reduced to patterns of ink. But those lines aren’t random. They are a way of showing the shape of the land on a flat sheet of paper.
Once you understand contour lines, a topo map becomes much easier to read. You can tell where a trail climbs steeply, where the terrain levels out, and where ridges, valleys, and saddles are hiding before you ever set foot on the trail.
What Is a Topographic Map?
A topographic map is different from a regular road map because it shows the shape and elevation of the land, not just where the roads and towns are. Instead of representing terrain as a simple flat surface, it uses contour lines, symbols, and other map features to show hills, valleys, ridges, slopes, and changes in elevation.
This is why topo maps are useful for hikers, backpackers, hunters, and anyone heading into terrain where understanding the shape of the land matters.
💡 Bottom Line: A topographic map turns the three-dimensional shape of the landscape into information you can read on a flat page.
What Are Contour Lines?
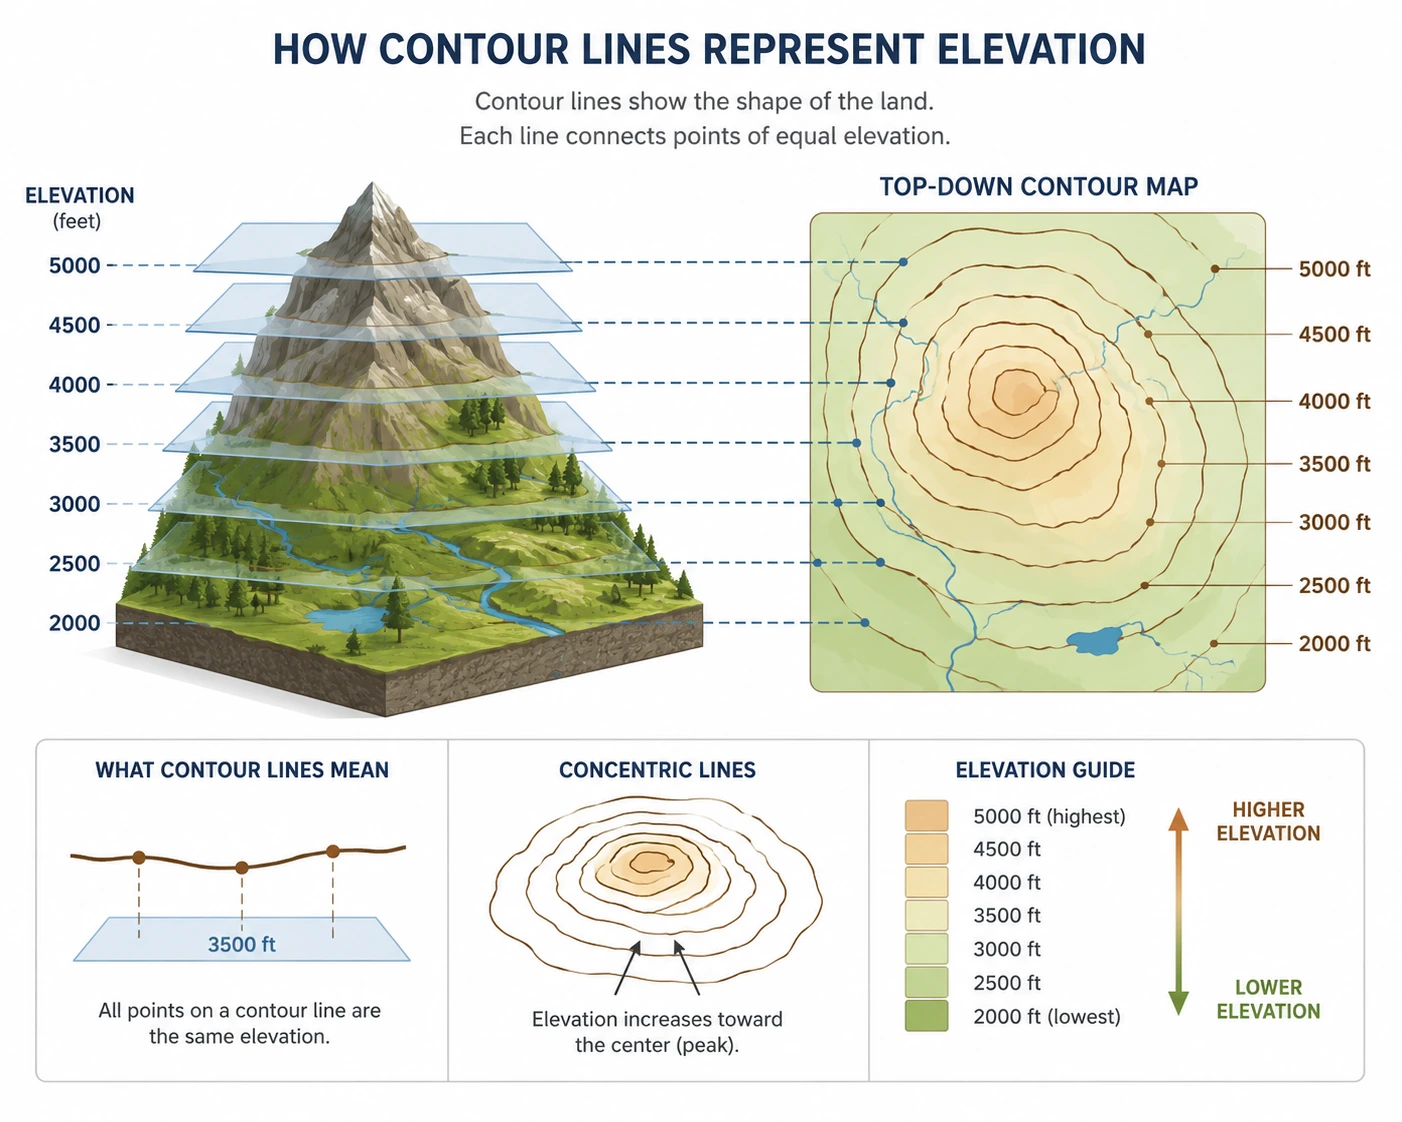
Contour lines are the thin lines, usually brown, that snake across a topographic map. Each one connects points that sit at the exact same elevation. If you physically walked along a single contour line, you’d stay at the same height above sea level the whole way, never climbing or descending.
A helpful way to picture this: imagine slicing a mountain horizontally into layers, like a loaf of bread, at regular height intervals. If you looked straight down from above, the outline of each slice would form one contour line.
On a normal topographic map, contour lines do not cross because a single point on the ground cannot have two different elevations at the same time.
For a more detailed explanation of how topographic maps represent elevation and terrain, see the USGS guide to topographic maps.
How to Read a Topographic Map in 5 Steps
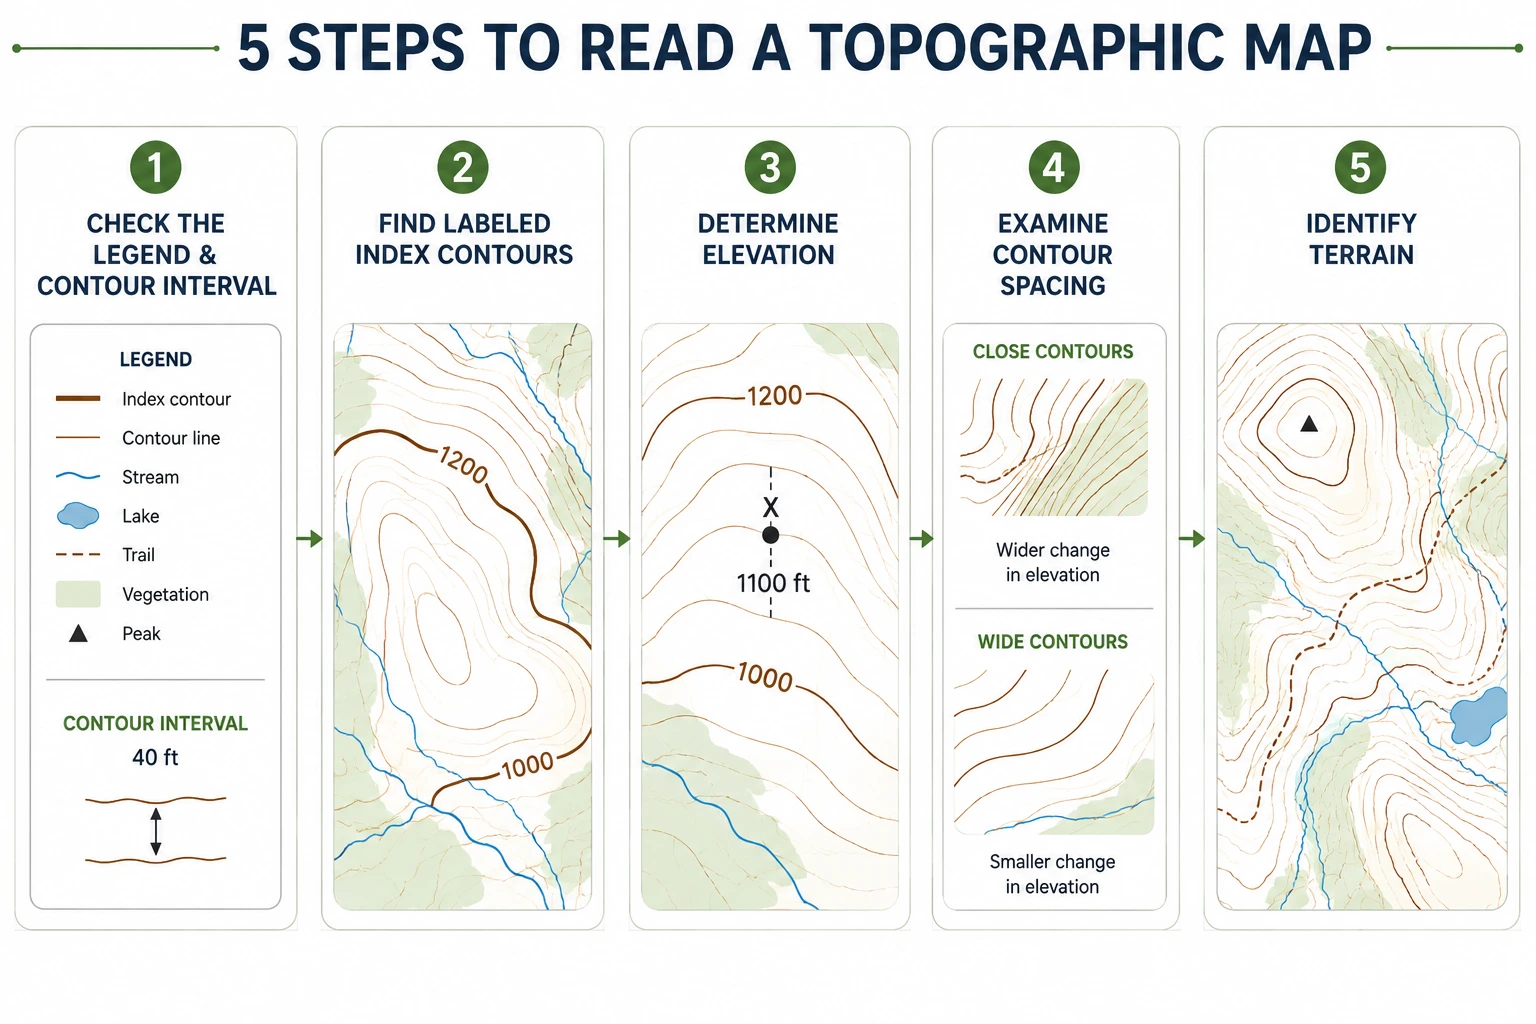
Reading a topographic map becomes much easier when you approach it in a consistent order:
- Check the map legend and contour interval: Start by checking the legend, scale, and contour interval so you know what the map’s lines and symbols represent.
- Find the labeled index contours: Use the bold, labeled contour lines as reference points for determining elevation. For example, if the contour interval is 20 feet and a point lies between the 1,000-foot and 1,020-foot contours, you can estimate its elevation based on its position between the lines.
- Determine elevation: Use the contour interval to work out the elevation of points between the labeled contours.
- Examine contour spacing to judge slope: Closely spaced lines indicate steeper terrain, while widely spaced lines indicate gentler slopes.
- Identify valleys, ridges, saddles, and other terrain features: Finally, look at the shapes of the contour lines to understand the terrain and identify major landforms.
💡 Bottom Line: Start with the legend and contour interval, then use contour elevations, spacing, and shapes to build a picture of the terrain.
Contour Interval
The contour interval is the vertical distance between one contour line and the next. The contour interval is usually given in the map margin or legend, and might be 20, 40, or 100 feet, depending on the map’s scale and how rugged the terrain is. A smaller interval gives you more detail; a larger interval is common on maps covering big, mountainous regions.
Many topographic maps use index contours, which are drawn more prominently and labeled with their elevation. You can use these bold lines as anchor points and count the thinner lines in between to work out elevation at any spot on the map.
💡 Bottom Line: The contour interval tells you how much elevation changes from one contour line to the next, making it the key to interpreting the numbers on a topo map.
Reading Slope Steepness
Once you understand contour lines, judging terrain steepness becomes almost intuitive:
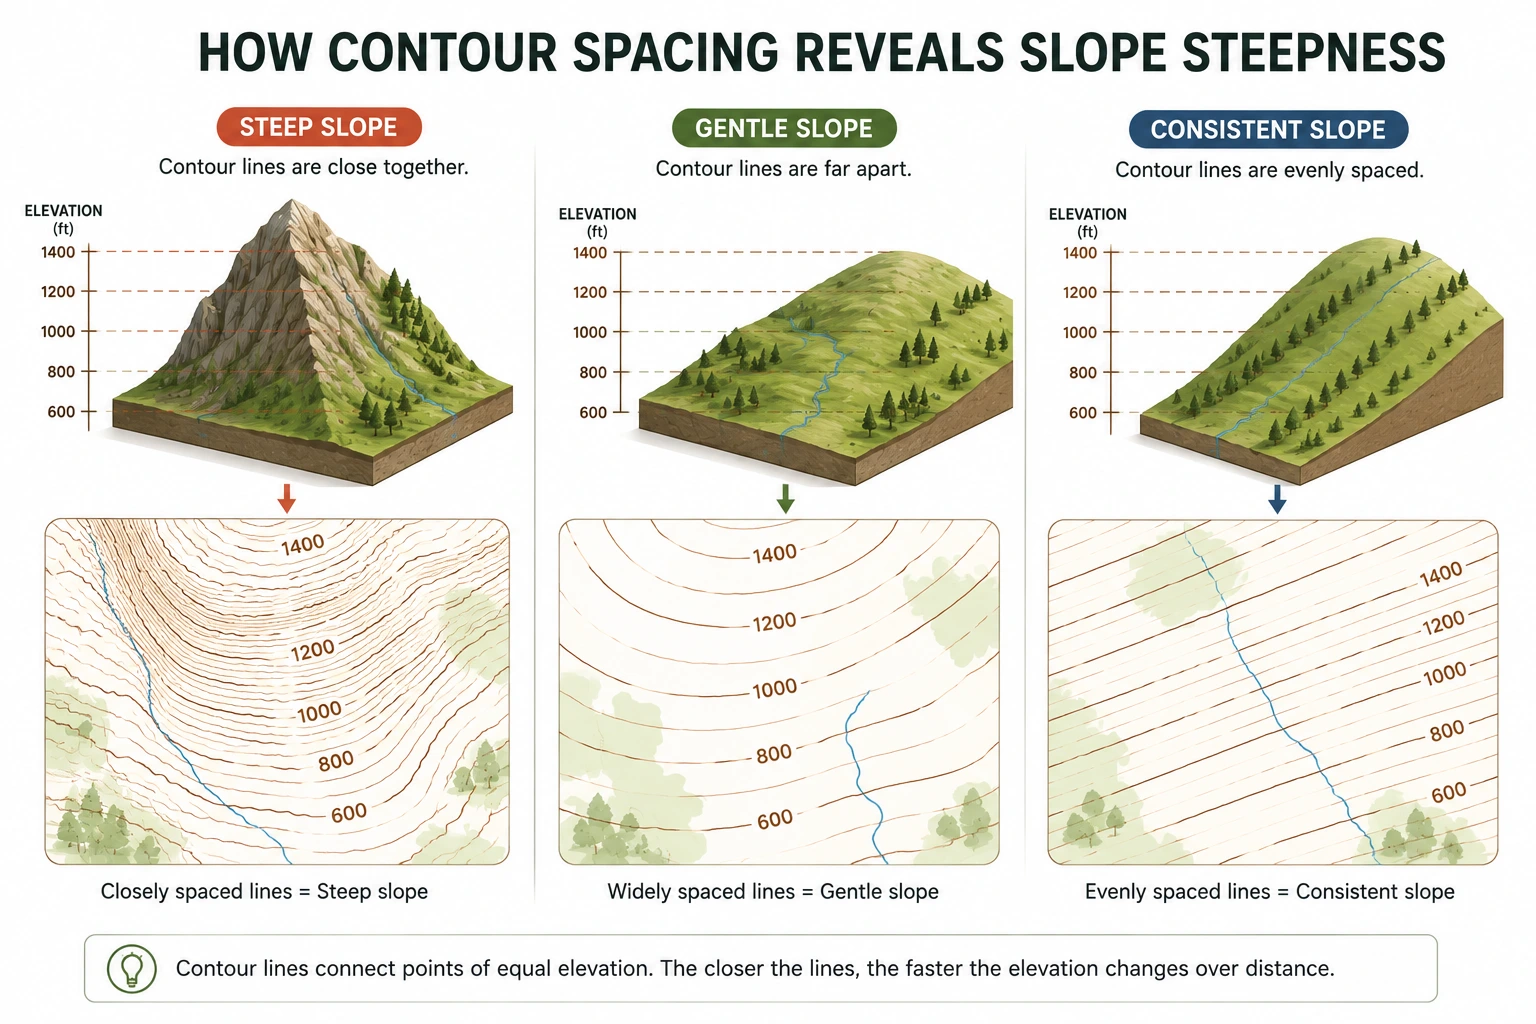
- Lines packed close together mean elevation is changing fast over a short distance, a steep slope or cliff.
- Lines spread far apart mean elevation changes more gradually, indicating a gentler slope.
- Evenly spaced lines generally indicate a consistent slope or grade over that section of terrain.
Ordnance Survey also explains how contour spacing can be used to visualize the steepness and shape of the terrain. See its guide to relief and contours for a visual introduction.
Identifying Common Terrain Features
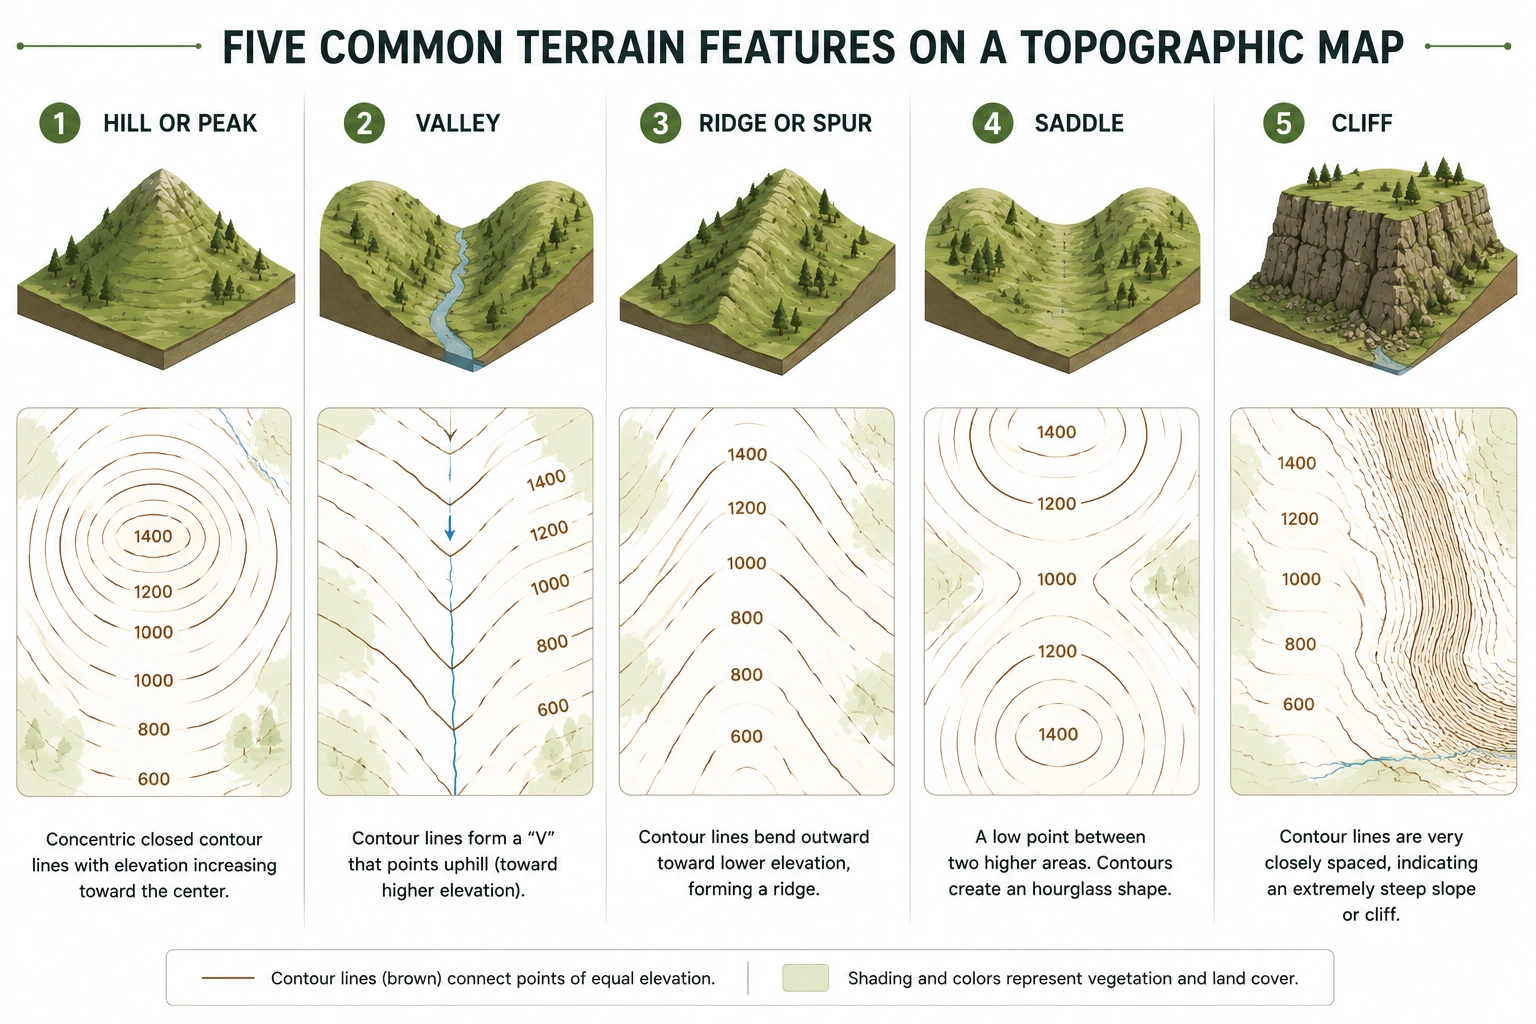
Contour lines aren’t just about steepness; their shapes reveal specific landforms. Here are the ones you’ll run into most often:
Hills and Peaks
Concentric closed contour lines commonly indicate a hill or peak, with elevation generally increasing toward the center. Depression contours are a separate case and are marked differently.
Valleys and Drainages
When contour lines form a “V” shape pointing toward higher ground, they usually indicate a valley, ravine, or drainage. The V generally points uphill, toward higher elevation, while water flows in the opposite direction, toward lower ground.
Ridges
Contour lines that bend outward toward lower elevation can indicate a ridge or spur, a strip of higher ground extending from a larger mountain or hill.
Saddles
A saddle is a low point along a ridge between two higher areas. On a topographic map, its contours often create an hourglass-like pattern. Saddles can provide natural passes between higher areas.
Cliffs
When contour lines are packed so tightly they nearly merge or touch, that’s a sign of an extremely steep slope or a cliff, a spot to approach carefully, or avoid entirely.
💡 Bottom Line: Contour spacing tells you how steep the terrain is, while the shape and direction of those lines help you understand what kind of terrain you’re looking at.
Colors, Symbols, and Scale: Reading the Map’s Legend
A topographic map is packed with information beyond just elevation. Cartographers use a standardized color scheme and a comprehensive legend to help you visualize what you will actually encounter on the ground.
Colors
Many topographic maps use common color conventions, but exact colors and symbols can vary by map series and mapping agency. Always check the legend.
- Green marks vegetation, like forests or wooded areas.
- Blue marks water — lakes, rivers, streams, and ponds.
- Brown is used for contour lines and elevation.
- Black marks man-made features, like buildings, roads, and trails.
- White may indicate open or non-forested ground on some topographic maps.
Scale
The scale tells you how distances on the map relate to real-world distances. It’s usually shown as a ratio, such as 1:24,000 on some detailed USGS topographic maps. At this scale, one inch on the map represents 24,000 inches, or about 2,000 feet, on the ground.
Scale matters just as much as elevation when you’re planning a route because it tells you how far you’ll actually be traveling between points on the map.
Symbols
Maps also use small icons and markings for specific features, things like campsites, trailheads, water sources, or bridges. These symbols aren’t always identical from map to map, which is why it’s worth checking the legend whenever you’re using an unfamiliar map. A quick glance there will clear up anything that doesn’t look standard.
If you’re unfamiliar with the symbols used on a USGS topographic map, the USGS guide to topographic map symbols provides a useful reference.
A Few Other Things Worth Knowing
Beyond the contour lines themselves, a couple of habits will make you a much more confident map reader:
- Check the map’s date. Trails, roads, vegetation, and other mapped features can change over time, so an older map may not perfectly match current conditions.
- Don’t ignore the legend and margin. The scale, contour interval, and any non-standard symbols are usually explained right in the margin. A quick glance can save you from misreading the map.
- Practice on a trail you already know. Pull up a topo map of somewhere familiar and compare what you see on paper to what you remember from being there. It’s one of the easiest ways to make contour lines feel like a representation of real terrain rather than a puzzle.
💡 Bottom Line: The fastest way to become comfortable with topo maps is to use them regularly. Practice somewhere familiar before relying on one in unfamiliar terrain.
Final Thoughts
Reading a topographic map becomes much easier once you know what the contour lines are telling you. With a little practice, you can use their elevation, spacing, and shapes to understand the terrain before you reach it.
You don’t need to memorize every symbol at once. Start by learning contour intervals, recognizing steep and gentle slopes, and identifying basic features such as hills, valleys, ridges, and saddles. Then practice with a map of a trail or area you already know.
A topo map may look complicated at first, but with practice, those lines start to look less like a puzzle and more like a picture of the landscape itself.
Frequently Asked Questions
A topographic map shows the shape and elevation of the land using contour lines, symbols, colors, and scale. It helps hikers and outdoor explorers understand hills, valleys, ridges, slopes, water features, and other terrain.
Each contour line connects points at the same elevation. The contour interval tells you the vertical elevation difference between neighboring lines. Closely spaced contour lines indicate steep terrain, while widely spaced lines indicate gentler slopes.
Closely spaced contour lines mean that elevation changes quickly over a short horizontal distance. This indicates a steep slope and, when the lines are extremely close together, may indicate a cliff or very steep terrain.
A V-shaped contour pattern commonly indicates a valley, ravine, or drainage when the V points toward higher ground. The contours generally point uphill, while water flows downhill in the opposite direction.
A hill or peak is commonly shown by concentric closed contour lines, with elevation generally increasing toward the center. The exact pattern can vary, so use the contour elevations to confirm which direction the land rises.
Map scale shows how distances on the map correspond to distances on the ground. For example, a scale of 1:24,000 means one unit of distance on the map represents 24,000 of the same units on the ground.
Colors help identify different types of terrain and features. Blue commonly represents water, green often indicates vegetation, and brown is commonly used for contour lines. Other colors may represent roads, boundaries, buildings, and additional features. Always check the map legend because conventions can vary.
Yes. By combining contour lines with trails, water sources, landmarks, scale, and other map features, you can identify steep climbs, gentler routes, ridges, valleys, and potential water sources before starting a hike.